The Oracle JRockit JVM is the industry's highest performing Java Virtual Machine now built into Oracle Fusion Middleware. It is a high performance JVM developed to ensure reliability, scalability, manageability, and flexibility for Java applications. The JRockit JVM delivers a new level of performance for Java applications deployed on Intel 32-bit (Xeon) and 64-bit (Xeon, Itanium, and SPARC) architectures at significantly lower costs to the enterprise.
The JRockit JVM makes it possible to gain optimal performance for your Java applications when running it on either the Windows or Linux operating platforms on either 32-bit or 64-bit architectures.
The JRockit JVM is especially well suited for running Oracle WebLogic Server.
JRockit Management Tools - Two main monitoring and administrative toolsets are provided with JRockit
You can use JRockit mission control 'jrmc' or command line utility 'jrcmd' to dynamically adjust heap size in a running instance.
Both toolset executables are located in the bin subfolder of the JRockit.
1. JRockit Command line interface ('jrcmd')
If no options are specified, jrcmd lists all the JRockit instances running on the local machine. If '0' is specified as the pid, the commands are sent to all JRockit processes.
# jrcmd [PID] <command>
To list the Ctrl-Break handlers that are available in a certain JRockit, use the help command,
# jrcmd <PID> help
Using jrcmd, you can execute many dynamic commands on a running JRockit JVM. For example, if JRockit was started without enabling the management server then by using the -Xmanagement option, it can be enabled without restarting the VM by using the jrcmd utility,
# jrcmd 2480 start_management_server
# jrcmd 2480 kill_management_server
2. JRockit Mission Control GUI ('jrmc')
JRockit Discovery Protocol (JDP) is based on multicast and enables the Mission Control to connect and manage JRockit JVMs. JRockit mission control is a group of management and monitoring tools like,
- 'JRockit Managment Consle' is a JMX Compliant monitoring tool.
- 'JFR JRockit Flight Recorder' records and helps you analyze the JVM and running application.
Flight recorder can also be run using the command line using below command,
# jrcmd <pid> FlightRecorder <options>
<options> like filename, recordingtime, nomethodssampling, nogcsampling, methodtraces, nozip, sampletime, nativesamples.
- 'JRockit Memory Leak Detector' detects and finds the cause for memory leaks.
JRockit Generational Heap
In the case of a two-generational garbage collector, objects are allocated in the young generation and eventually moved to the old generation if they are alive.
In a single-generation garbage collection, the heap is treated as a single contiguous space and there is no notion of nursery.
When a two-generational garbage collector is used, all thread-local areas (used for allocation of small objects) are allocated in the nursery, whereas large objects are allocated in the old space.

The below command starts the JVM with a heap of 800MB, allowing it to grow up to 1000MB. The garbage collection is set to optimize for pause times, and the nursery size is set to 200MB.
# java -Xms:800m -Xmx:1000m -Xns:200m -Xgc:pausetime -XpauseTarget:250ms MyTransactionApp
JVM management using Weblogic Administration Console

A sample script to start a managed server with custom JVM settings:
# exprot JAVA_VENDOR="Oracle"
# export USER_MEM_ARGS="-Xms512m -Xmx1g"
# $DOMAIN_HOME/bin/startManagedWebLogic.sh
You can also use JRockit mission control 'jrmc' or command line utility 'jrcmd' to dynamically adjust heap size in a running instance.
Heap Fragements: Repeated allocation and freeing of memory may cause pockets of small and dispersed memory.
Concurrent Collection: Frequent full garbage collection can lead to unacceptable pausingof application processing. The concurrent garbage collection strategy enables garbage collection to be run in the background without stopping all the application threads. Note that if the CPU Usage of the machine is over 80% then concurrent GC threads may not be able to work properly.
Pausing to compact: Heap compaction reduces fragmentation. Compaction requires Java threads to be paused. Pause duration depends on the number of fragments that need to be compacted.
WLS Administration Console Initiated Garbage collection:
Login to WLS console > servers > managed server > Monitoring > Performance Tab
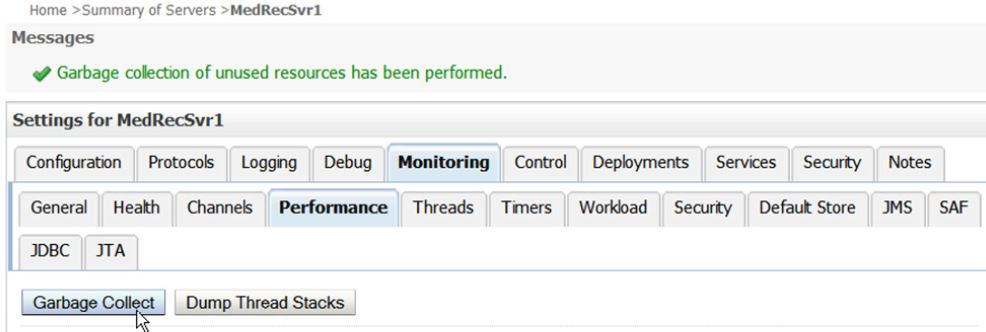
Detecting low memory conditions using WLS console
We can configure the WLS to automatically detect low memory conditions. When low memory is detected then WLS will logs the condition and changes the server health's state to "Warning."
The average free memroy of different samples during a cofigured time interval is compared with the average of the next time interval, and if the difference drops by a configured value, this condition is also logged and the health state of the server changes to "Warning."
Login to WLS console > servers > managed server > Monitoring > Performance Tab

For any queries on this topic don't hesitate to contact me on samiappsdba@gmail.com
Bibliography:
http://docs.oracle.com/cd/E13150_01/jrockit_jvm/jrockit/geninfo/diagnos
http://docs.oracle.com/cd/E13150_01/jrockit_jvm/jrockit/geninfo/pdf/diagnos.pdf
http://www.oracle.com/technetwork/middleware/jrockit/overview/index.html
An interesting article, An overview to Creating usable JVM Languages can be found in below link,
https://www.toptal.com/software/creating-jvm-languages-an-overview
Also go through the blog that covers a variety of topics, across many programming languages and dev/design.
https://www.toptal.com/blog